


Technical lead for a team building performance controls within the Chrome Desktop browser. We empower users with options to decrease memory consumption and increase battery life. Navigated a new technical stack and tight timelines to successfully launch Memory Saver and Energy Saver mode. Development is done in a mix of Polymer TypeScript and C++.

Developed and maintained frontend infrastructure for Google Cloud's Console with a focus on performance and maintainability. Drove large swaths of a massive migration from AngularJS to Angular which involved rewriting parts of the application shell, inverting the bootstrapping order of the two frameworks, and methodically turning down all aspects of the old framework. Stabilized routing across our dual bootstrapping setup and our microservices architecture. Most work utilized Angular TypeScript.

Built PDF download and keyword and ad segmentation for Executive Reporting. Rewrote the Campaign Management change history frontend to utilize an upgraded backend with more robust data. Migrated internal service wrappers off a soon-to-be-deprecated API with a tight deadline. Worked with Java, Dart, and JavaScript.
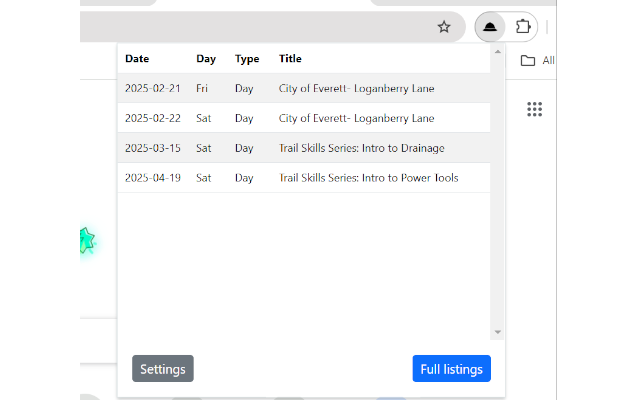
Created a Google Chrome extension to receive notifications when new WTA trail work parties are posted. It queries the list of work parties every hour and compares that to list the list of work parties previously seen. New work parties trigger a notification count on the extension icon. Clicking the extension opens a dialog that lists all new events and has a link to view the official listings to register.
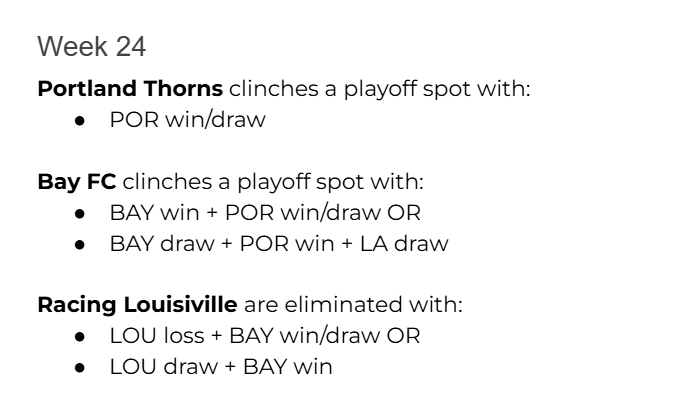
Built an integer programming model to calculate the highest or lowest possible position that a team could finish in the NWSL table given the current standings and future games. Utilized OR-tools to solve the optimization problem. Expanded this to calculate all scenarios in an upcoming weekend that result in a team either clinching a playoff spot or being eliminated from the playoffs.
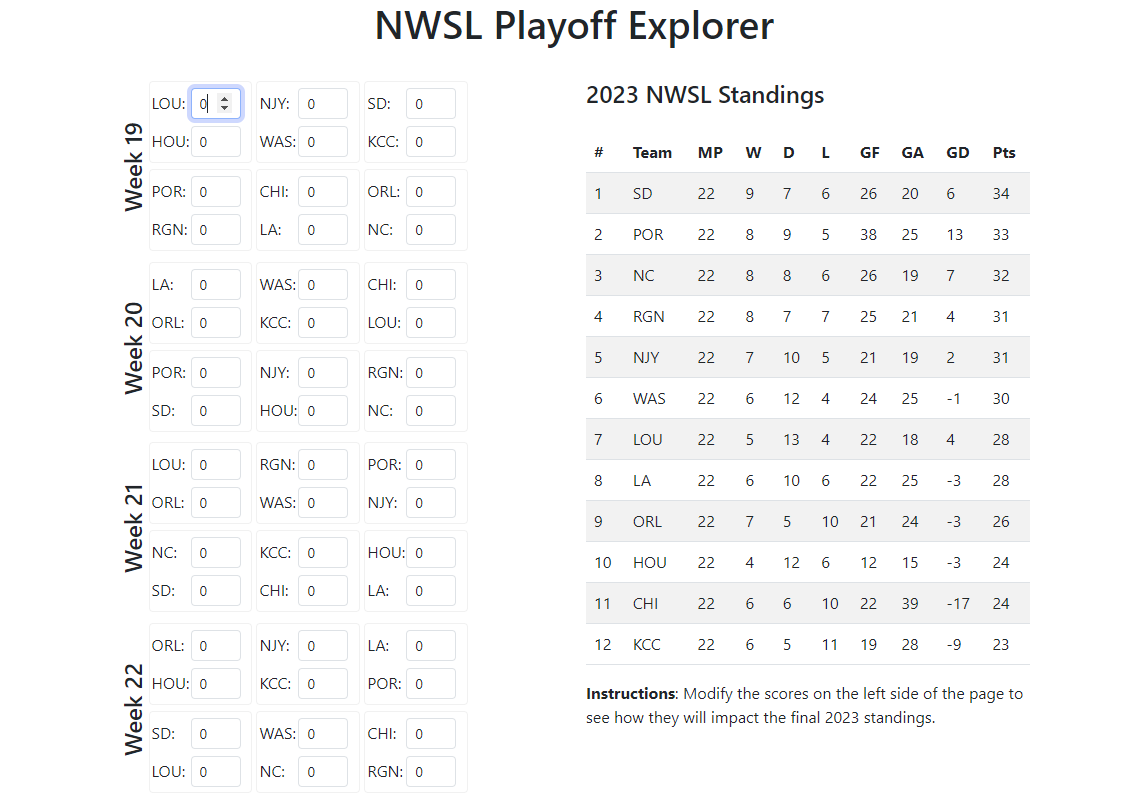
Created a website where people could see how the NWSL table would end up with hypothetical match results for the final weeks. With the standings being so tight, this tool became very important to determine which outcomes were feasible. To supplement this, I wrote scripts to calculate how teams could clinch playoff spots or be eliminated.
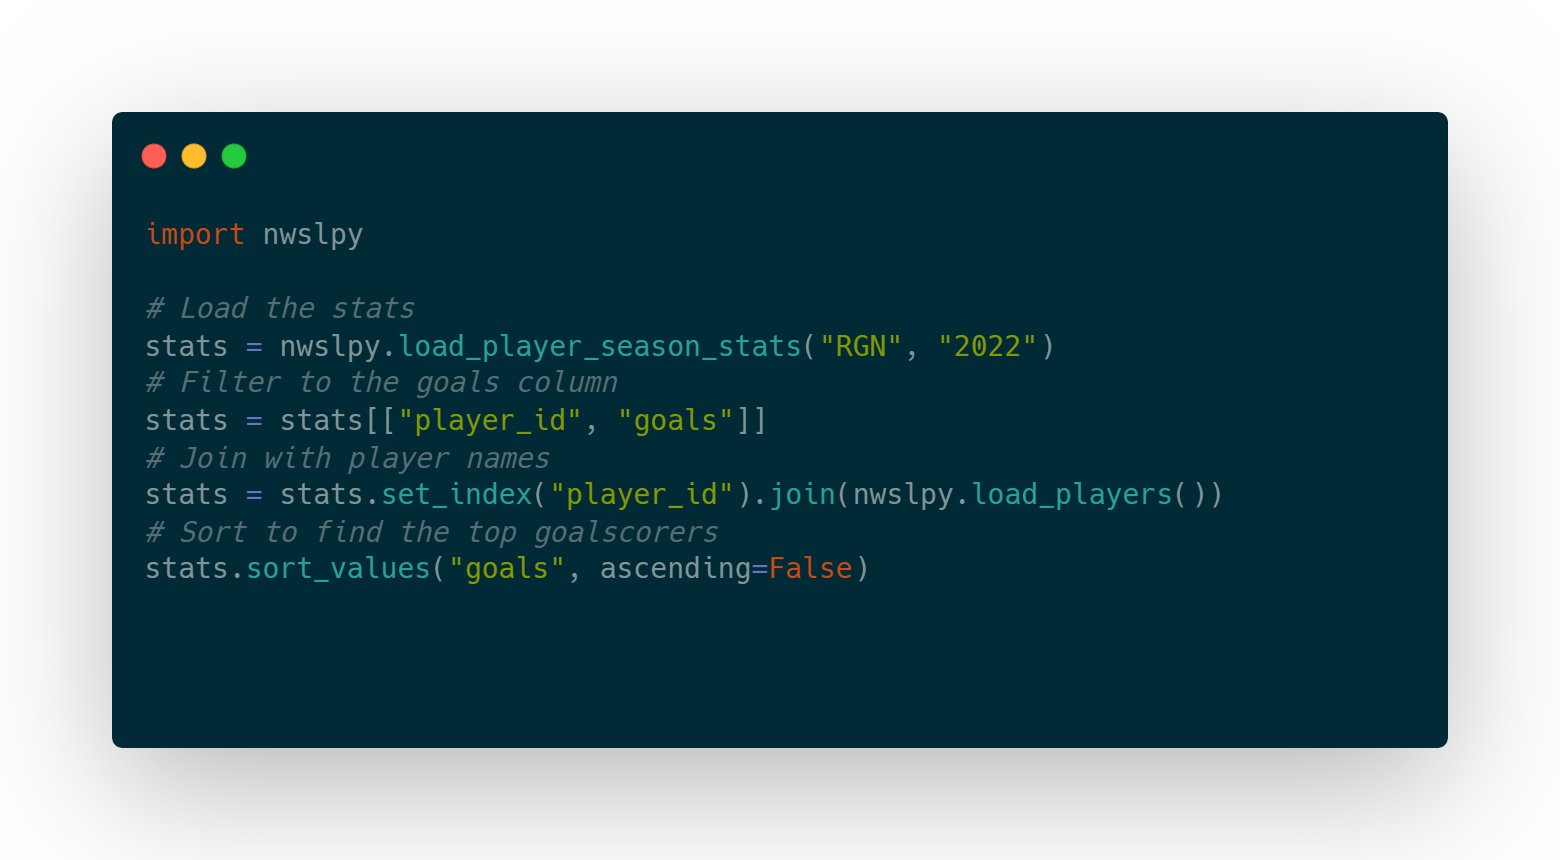
Created a wrapper around the nwslR library to make NWSL data accessible from Python. Contributed this wrapper upstream as an extension of the nwslR project with the goal of expanding access to women's soccer data. Data includes player and match statistics going back to 2016.
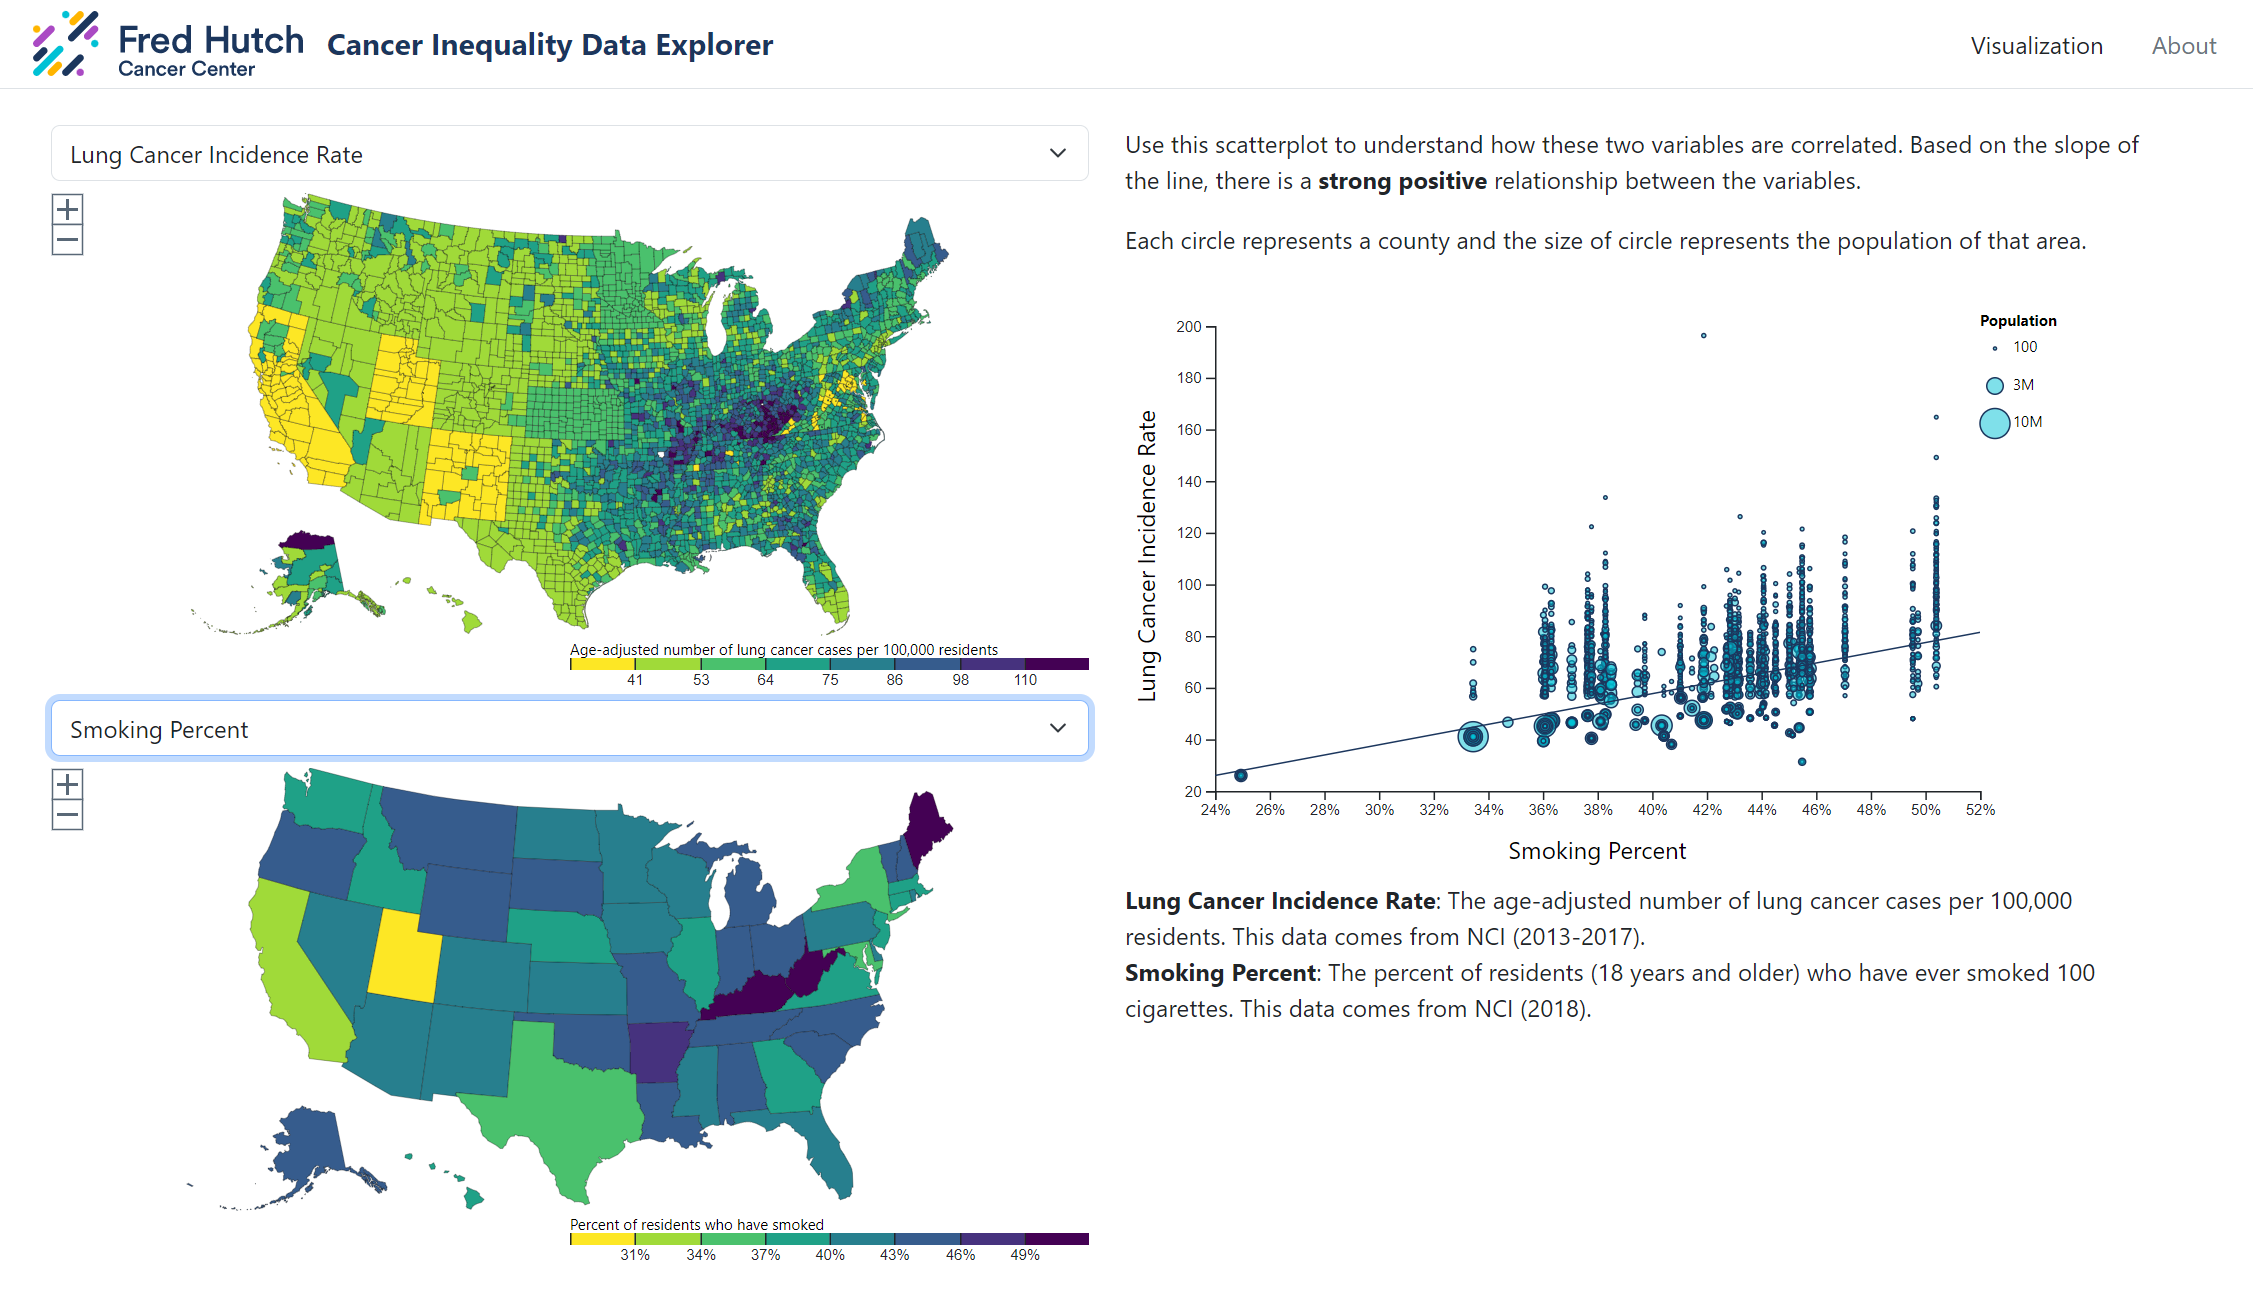
Built this web app with my partner Danilo Benzatti as a Capstone project for the UW Data Science Masters program. We collaborated with Fred Hutch Cancer Center to create a tool to help students explore data that might impact the incidence and outcomes of different types of cancer. We visualized data by county and highlighted correlations between metrics which will help improve data literacy and interest in mitigating healthcare inequality.
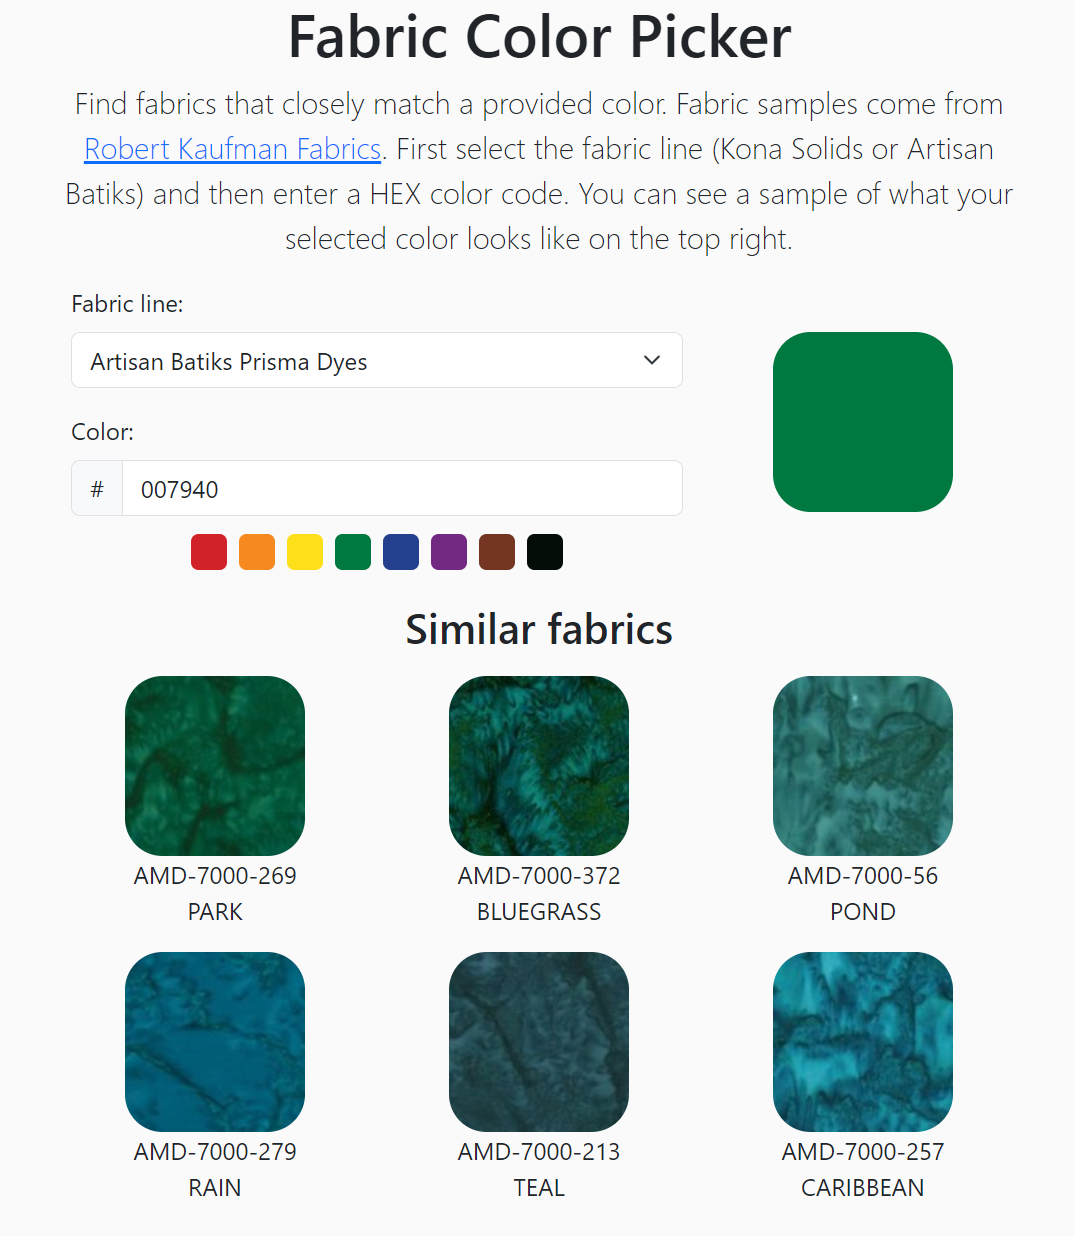
While designing quilts I found myself spending tons of time trying to find the right shade of fabric to match a specific color code. This inspired me to build this simple web app that allows you to find fabrics with a similar average color to a provided HEX color code. It includes both solid and batik fabric lines.
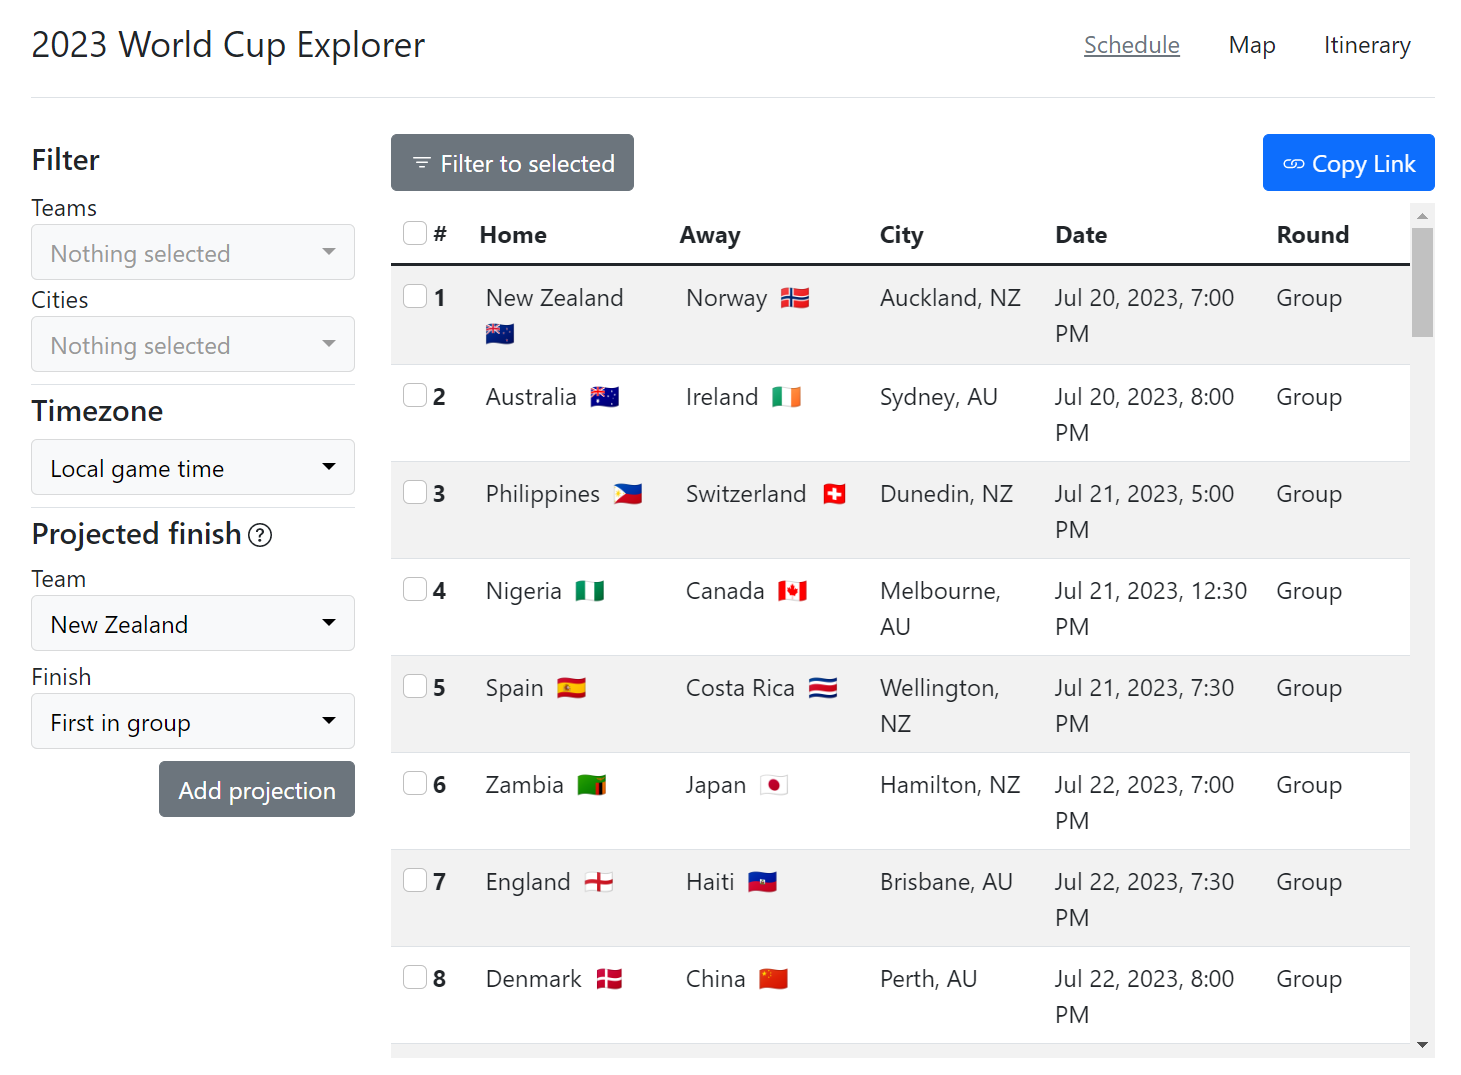
Developed a revised website for exploring the teams and schedule for the 2023 Women's World Cup. This site features an interactive schedule that allows projecting the schedule based on team finish, a tool to plan an itinerary based on team preferences, and a map to visualize a team's path as they progress through the tournament.
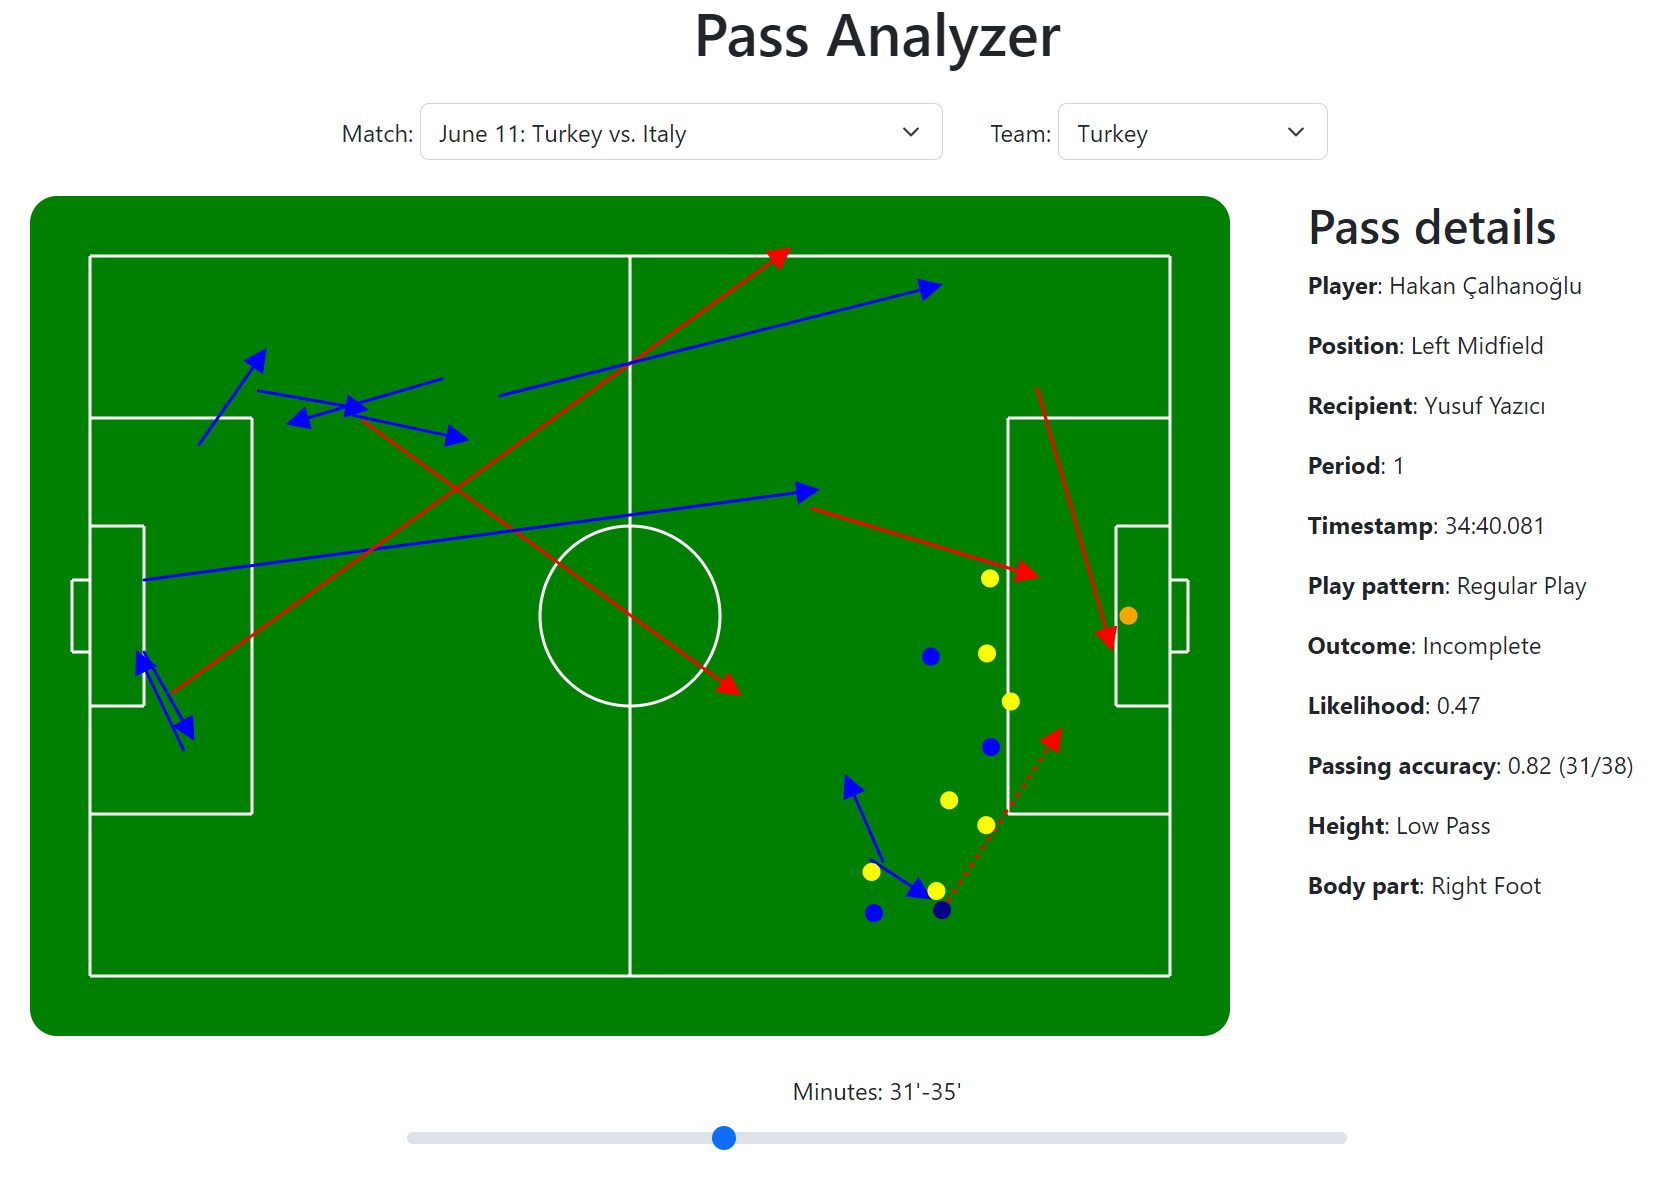
Won a finalist prize for Pass Analyzer: an app to visualize information about passes during the 2020 Men's Euros. Trained a pass completion likelihood model in Python and included that data alongside other key details for each pass. Visualized all passes within discrete time periods, including player locations, using d3.
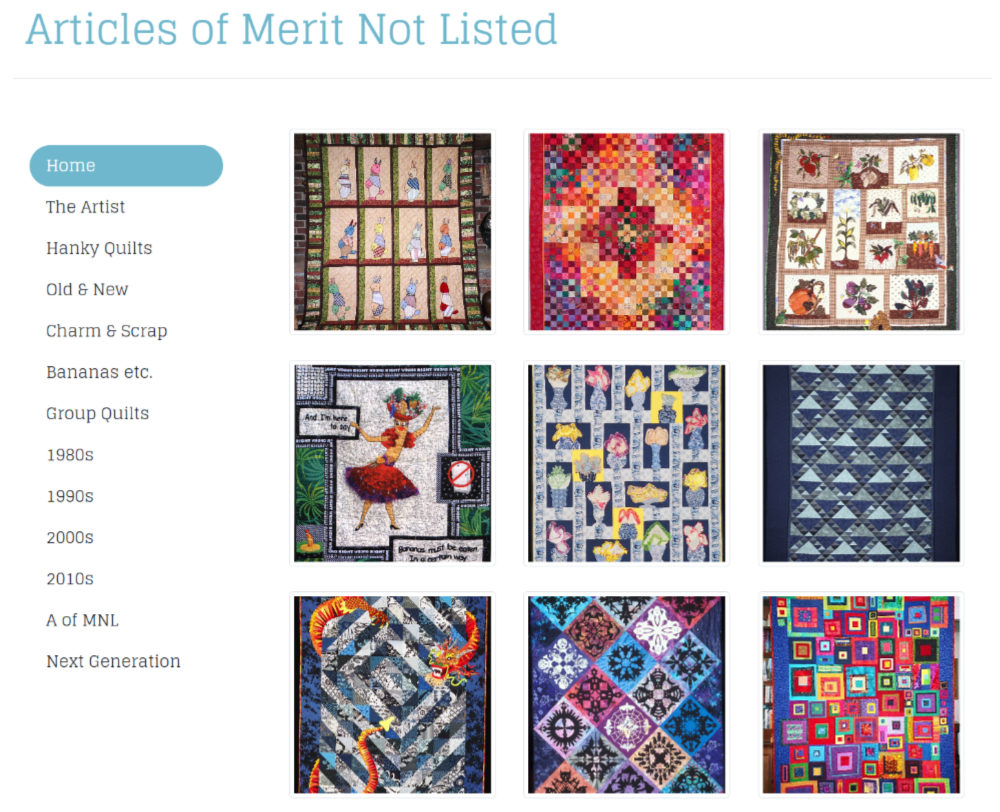
Developed a site to highlight quilts made by my Grandmother. Over the course of 35 years, she crafted a wide variety of quilts ranging from technically complex geometric paterns to whimsical designs based on a candle salad. After being inspired to follow in my Grandmother's footsteps by crafting my own quilts, I added a new page to the site which highlights my creations (link).
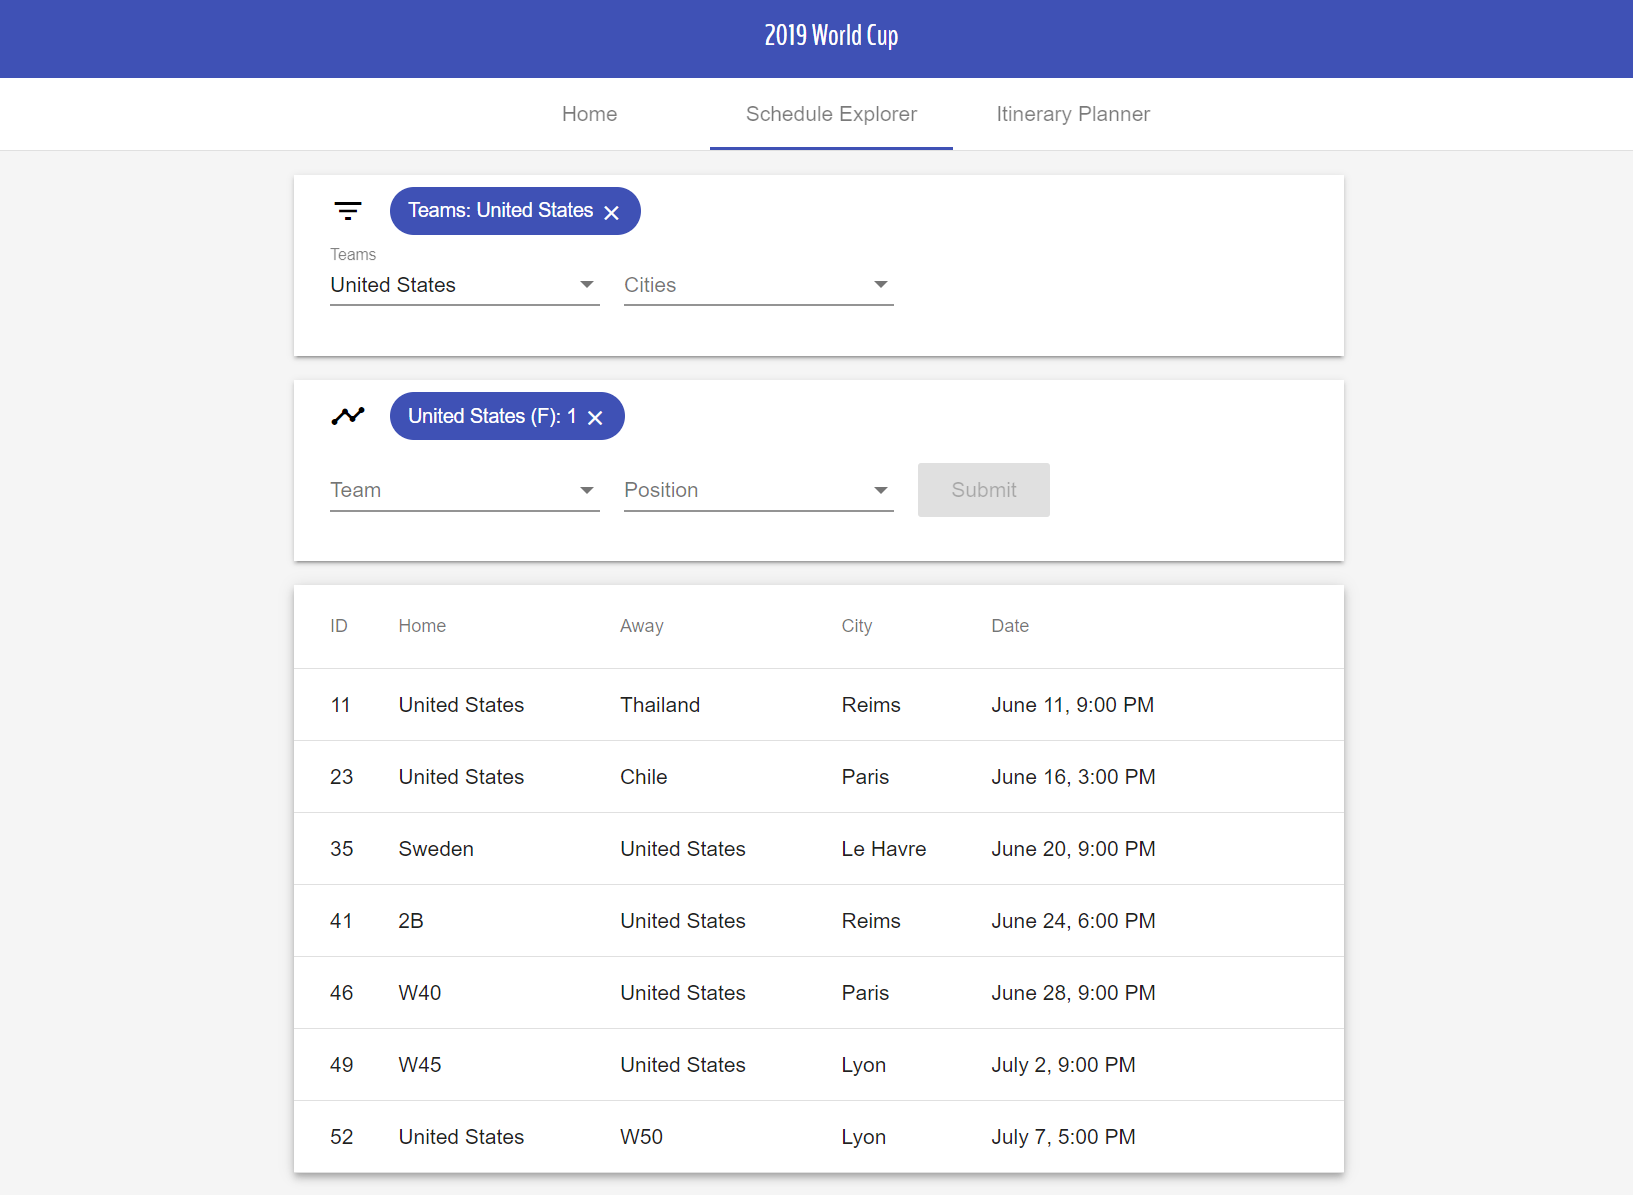
Developed a website for exploring the teams and schedule for the 2019 Women's World Cup. This site features a map of all teams, an interactive schedule that allows projecting the schedule based on team finish, and a tool to plan an itinerary based on team preferences. Because it was relatively easy to travel between cities, calculating an optimal path via a greedy algorithm proved quite successful.
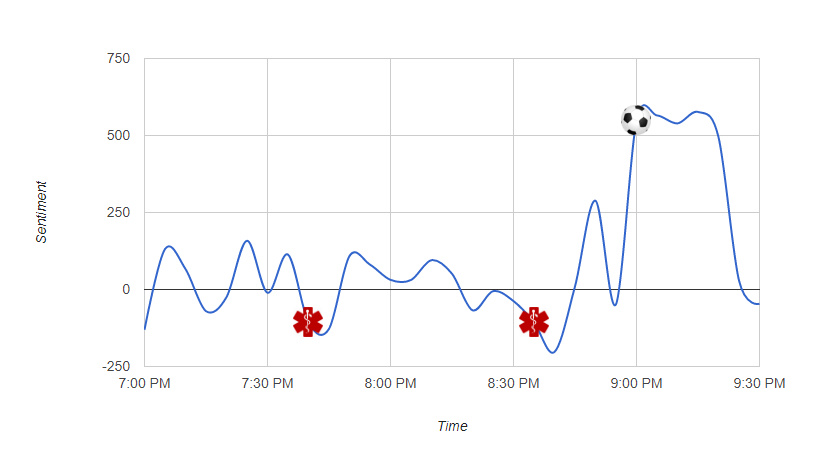
Won 2nd place for developing a fan-engagement app that allows users to compete by predicting key game stats. I focused on a section that scraped Tweets during a soccer game and compared user sentiment on Twitter to key game events like goals or injuries.

Courses included Data Visualization, Data Management for Data Science, Scalable Data Systems & Algorithms, and Statistical Machine Learning. This program was heavily project based, and allowed me to explore different data visualization technologies like R, Python, and Tableau as well as different data warehousing solutions. Outside of my coursework, I also began exploring sports analytics and visualization.

Courses included Computational Linguistics, Design and Analysis of Algorithms, Data Science, Database Management Systems, and Machine Learning. Served as a teaching assistant for several classes, which required leading lab sections, assisting students, and grading student projects. During this time, I also completed two internships at Microsoft and one at Facebook.